

TECHNICAL NOTE
Quloud-Mag Explanation (3) Simulation application introduction
In this third part, we will introduce some actual simulation examples using Quloud-Mag.
INTRODUCTION
EXAMPLE 1
Example 1 of magnetic material simulation using Quloud-Mag: Neodymium magnet
First, we will introduce the results of applying it to a neodymium magnet, a representative strong magnet. Neodymium magnets are the most commonly used magnets today, and are known to be the strongest magnets. However, this neodymium magnet was known to exhibit a behavior called "spin reorientation" that weakens the magnetic properties in the low temperature region (the threshold is called the spin reorientation temperature, and is experimentally known to be around 100K). In addition, the physics that causes this spin reorientation is said to be due to the crystal field effect, and in order to reproduce this physics, a phenomenological approach has been taken in which the crystal field effect is incorporated into the magnetic anisotropy and fitted to the experimental values. If we continue to rely on this phenomenological approach, it will be difficult to truly predict new materials. Against this background, we applied Quloud-Mag to this neodymium magnet, and the results are as follows:
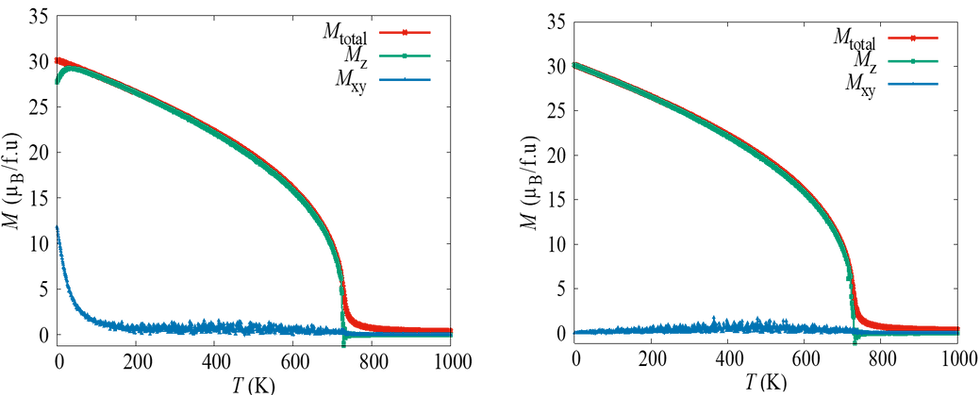
The results of the temperature dependence of the magnetic moment are shown in the Monte Carlo simulation. The simulation results show that the absolute value of the magnetic moment (red curve) increases monotonically with decreasing temperature. On the other hand, the z component of the magnetic moment (green curve) starts to decrease from about 100K, and the xy-plane component rises sharply. In other words, the magnetic moment starts to lie down from the z-axis direction to the xy-plane direction at about 100K. This means that the "spin reorientation" observed in the experiment was reproduced without experimental values. This is the first result in the world. In order to clarify the cause of this spin reorientation, we performed a simulation by removing the Dzyaloshinsky-Moriya interaction term from the Heisenberg Hamiltonian in the Monte Carlo simulation. The results are shown in the graph on the right. As you can see, it shows a completely different behavior from the simulation results on the left. In other words, the physics that causes spin reorientation, when viewed from a more atomic level, is the Dzyaloshinsky-Moriya interaction, and it is the effect of simulation that makes it possible to predict the spin reorientation temperature without experimental values. The spin reorientation phenomenon is not limited to neodymium magnets. It is also seen in other rare earth magnetic materials. For comparison, we will introduce the calculation results for other materials.
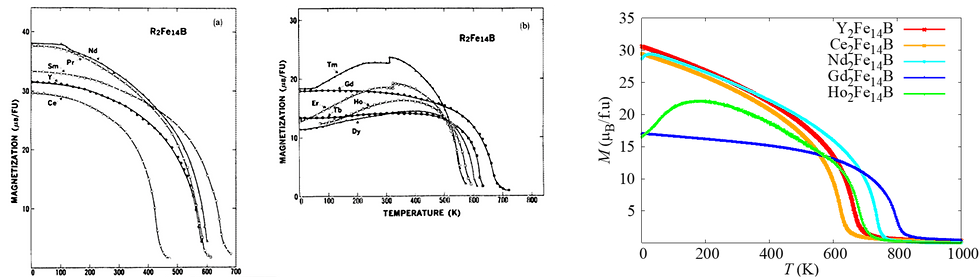
The two graphs on the left are experimental results reproduced from the paper (S. Hirosawa et al, J. Appl. Phys. 59, 873 (1986)). On the other hand, the graph on the right is the result of our simulation using Quloud-Mag. It can be seen that the experiment is reproduced well. In this way, Quloud-Mag is an extremely powerful tool for elucidating and predicting the magnetic properties of magnetic materials. The results obtained here have been reported in a paper (H. Tran and Y. Matsushita, Applied Materials Today 32, 101825(2023) ).
EXAMPLE 2
Magnetic material simulation example 2 using Quloud-Mag: Nanoparticle system
We present two results of applying Quloud-Mag to nanomagnetic particles. L10-type FePt is known as a material with magnetic anisotropy that exceeds that of neodymium magnets, and is used as a memory device material such as magnetic tape. In magnetic memory devices, digital 0 and 1 data is recorded depending on the direction of the magnetic moment (up or down), and it is required to keep the written data for a sufficiently long period of time without losing it. If the nanoparticles are too small, it becomes difficult to keep the data for a sufficiently long period of time, while if the nanoparticles are too large, the data capacity per unit area becomes small. In order to increase the data capacity while maintaining a sufficient data retention period, it is important to understand the behavior of magnetic materials in nanoparticle systems. Against this background, we used Quloud-Mag to simulate the nanoparticle properties of L10-type FePt.
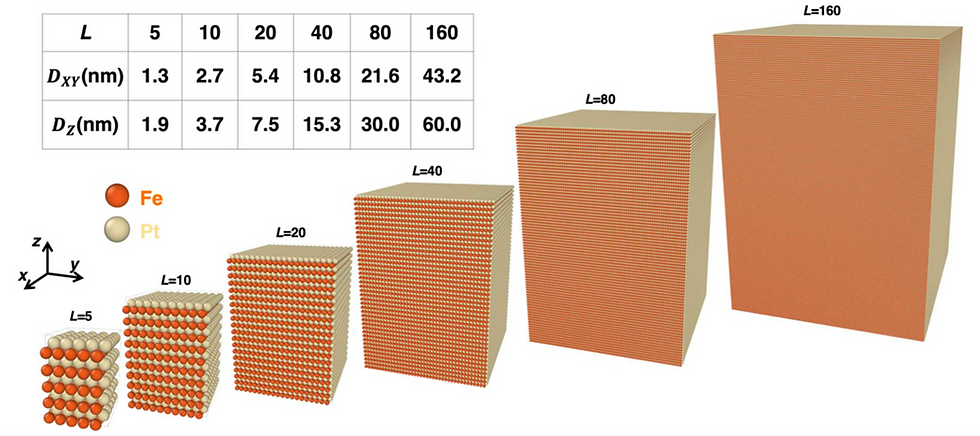
These are the crystal structures of L10-type FePt nanoparticles of various sizes used in the simulation.

The results of calculations using Monte Carlo simulations are shown. In the graph on the left, the red curve shows the behavior of temperature in bulk (crystal). It can be seen that the simulation predicts that the Curie temperature is about 600K. On the other hand, as the nanoparticle diameter is reduced, the Curie temperature gradually decreases. In particular, it can be seen that the smallest nanoparticle diameter (blue curve) does not show a clear Curie temperature. This indicates that the nanoparticles are in a superparamagnetic state, which will be explained later. The graph on the right shows the Curie temperature normalized by the bulk temperature for each particle diameter. At the same time, the behavior obtained from the experiment is also plotted. As shown in the graph, it can be seen that the Curie temperature decreases as the particle diameter is reduced, and that this behavior closely reproduces the experiment.
The results of calculations using Monte Carlo simulations are shown. In the graph on the left, the red curve shows the behavior of temperature in bulk (crystal). It can be seen that the simulation predicts that the Curie temperature is about 600K. On the other hand, as the nanoparticle diameter is reduced, the Curie temperature gradually decreases. In particular, it can be seen that the smallest nanoparticle diameter (blue curve) does not show a clear Curie temperature. This indicates that the nanoparticles are in a superparamagnetic state, which will be explained later. The graph on the right shows the Curie temperature normalized by the bulk temperature for each particle diameter. At the same time, the behavior obtained from the experiment is also plotted. As shown in the graph, it can be seen that the Curie temperature decreases as the particle diameter is reduced, and that this behavior closely reproduces the experiment.

Above we looked at the behavior of nanoparticles against strong magnets. We are also simulating the effect of nanoparticles on soft magnetic materials. As one result, we will introduce the results for γ-Fe2O3.
The results are calculated using a Monte Carlo simulation. It can be seen that the simulation predicts a Curie temperature of about 1200K. On the other hand, as the nanoparticle diameter is reduced, the Curie temperature gradually decreases, just as with L10-type FePt. The graph on the right shows the Curie temperature normalized to the bulk temperature for each particle diameter.
EXAMPLE 4
Magnetic material simulation example 4 using Quloud-Mag: Magnetocaloric effect
We will introduce the results of magnetocaloric effect simulation using Quloud-Mag. In recent years, the magnetocaloric effect has attracted attention as a next-generation cooling method to replace refrigerant gas. The search for magnetic materials that show a larger magnetocaloric effect has become active. One indicator of the magnitude of the magnetocaloric effect is the physical quantity called entropy change. The larger the entropy change of a material, the larger the magnetocaloric effect it shows. The magnetocaloric effect is known to take on huge values at the first-order magnetic phase transition, and the discovery of a material that shows a first-order magnetic phase transition attracts great attention. In particular, when trying to use these materials as a cooling method, it is necessary to design the material so that the first-order magnetic phase transition occurs at the desired temperature, which becomes the stage for materials research. The extent to which the first-order phase transition temperature can be changed by mixing what elements and to what extent is an ideal subject for simulation to demonstrate its strengths. Here, we calculated the first-order magnetic phase transition temperature when element doping was performed on La-Fe-Si-based materials, which are attracting attention as materials that show a first-order magnetic phase transition.

The figure on the left shows the crystal structure of the La-Fe-Si system, and plots the change in the first-order magnetic phase transition temperature (Curie temperature) when La atoms or Fe atoms are partially replaced by other elements X and Y.
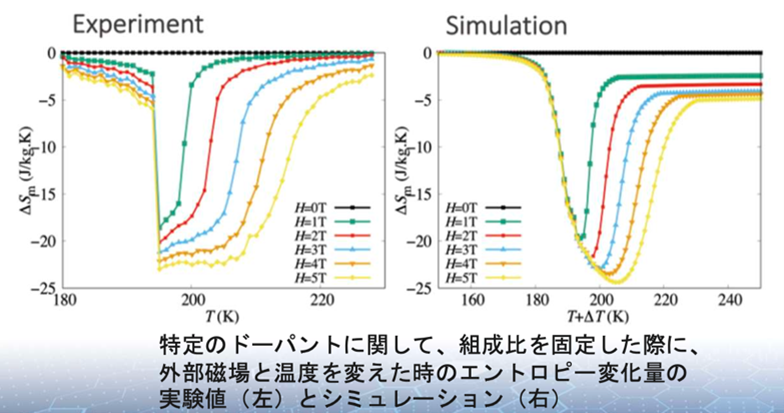
The figure on the left shows the experimental value (left) and the simulation result (right) when simulating the entropy change of the La-Fe-Si system. As can be seen from the figure, the peak height and temperature range seem to reproduce the experiment well. In this way, it can be seen that the simulation is also effective in searching for materials that exhibit new magnetocaloric effects.
EXAMPLE 3
Example 3 of magnetic material simulation using Quloud-Mag: Magnetic loss simulation
We will introduce Quloud-Mag for magnetic loss simulation, especially complex permeability simulation. Complex permeability is one of the basic physical parameters that express the magnetic properties of a material, and its real part represents the ratio of the magnetic field to the magnetic flux density, while the imaginary part represents the amount of energy absorbed by an oscillating magnetic field with a certain frequency. In particular, materials with a small imaginary part of complex permeability are being sought for magnetic materials for 5G and 6G, and are becoming an important element in energy-saving devices. Quloud-Mag is the only software in the world that can predict complex permeability without experimental values.
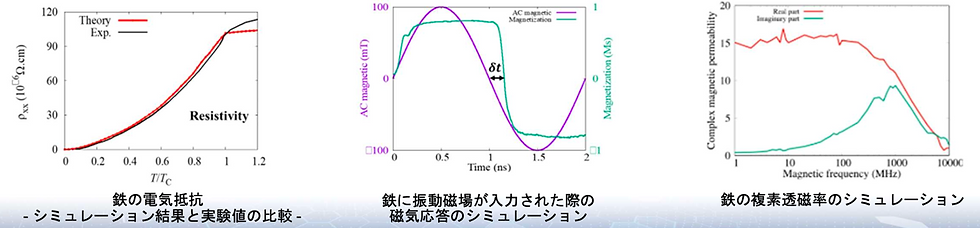
The left figure shows the results of a Monte Carlo simulation, comparing the simulated results (red curve) and experimental values (black curve) of the electrical resistance of iron. The horizontal axis is temperature, normalized by the Curie temperature, and the vertical axis shows the electrical resistance. The Curie temperature of iron is approximately 1000K, and the experiment and simulation results are well reproduced over a wide range from 0K to 1000K, as can be seen from the figure. To reproduce the electrical resistance of a magnetic material such as iron, not only scattering by phonons but also the scattering effect of magnetism must be taken into account, and this result shows that the magnetic properties at finite temperatures can be reproduced with very high accuracy. When calculating energy loss, energy loss due to eddy currents is one factor, but electrical resistance is important when calculating energy loss due to eddy currents. Next, the center figure and the right figure show the results of a micromagnetic simulation. In the center figure, the response of the magnetic moment of iron (green curve) to an external magnetic field (purple curve) is shown. First, in the initial state where there is no external magnetic field, the magnetic moment is zero, but this means that there are multiple magnetic domains in the iron, which cancel each other out when viewed macroscopically, resulting in a magnetic moment of zero. In real iron, the magnetic properties are also hidden when there is no external magnetic field. This situation is reproduced. In this situation, when an external magnetic field is introduced, the iron responds to the external magnetic field and the magnetic moments each have a finite value. On the other hand, the external oscillating magnetic field begins to turn in the opposite direction after 1 [ns], but the iron cannot immediately respond to the external magnetic field, and a response delay δt occurs. With the response delay, the magnetic moment follows the external magnetic field and can be seen to flip in the opposite direction. In fact, this response delay δt is an important quantity that represents energy loss. The larger the delay, the greater the energy loss. In fact, by using a conversion formula for this δt, the complex permeability shown in the figure on the right can be calculated. The real part of the complex permeability (red curve) and the imaginary part (green curve) are shown. The magnetic permeability on the vertical axis is plotted against the vibration frequency on the horizontal axis. As can be seen, at 1 GHz the imaginary part has a peak structure, and energy is absorbed to a maximum. In fact, it is known experimentally that the imaginary part of pure iron has a peak structure at 1 GHz, and the results of this simulation closely reproduce the experiment.
EXAMPLE 5
Magnetic material simulation example 5 using Quloud-Mag: Search for skyrmion materials
Here is an example of the search for new magnetic materials using Quloud-Mag. Here, we introduce an example of the search for skyrmion materials. In recent years, a magnetic material called skyrmion has attracted attention as a material for next-generation high-density memory and quantum computer devices. Skyrmions have a spin structure in which spins are swirled, and there are two types of vortex winding: clockwise and counterclockwise. The aim is to build a next-generation computer by associating the presence or absence of skyrmions with digital information of 0 and 1, and by associating the clockwise and counterclockwise rotation of skyrmions with digital information of 0 and 1. In particular, when used as memory, it is preferable to have skyrmions that are as small as possible, since the size of the vortex is directly linked to the recording capacity. Furthermore, a material that can control the clockwise and counterclockwise rotation is required. Many skyrmion materials have been reported so far on the surface or interface of crystals with broken spatial inversion symmetry. In addition, many of them are manifested due to the Dzyaloshinsky-Moriya interaction that appears when spatial inversion symmetry is broken. Against this background, we carried out simulations of the two-dimensional layered material MCl3 (M: transition metal). One important thing to note here is that MCl3 has spatial inversion symmetry, and at first glance it appears that the Dzyaloshinsky-Moriya interaction does not manifest. However, the simulations showed that spatial inversion symmetry is broken locally, and the Dzyaloshinsky-Moriya interaction can actually be non-zero. Since the Dzyaloshinsky-Moriya interaction is finite in two-dimensional materials, it was found that skyrmions can manifest.
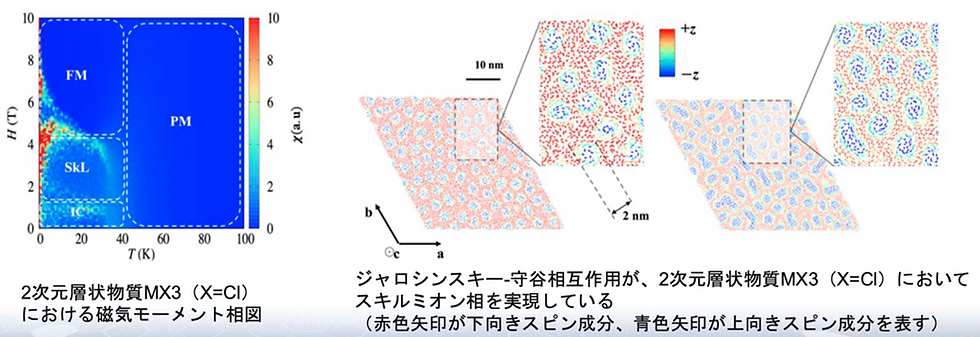
The left figure shows the results obtained by Monte Carlo simulation, showing the phase diagram of the external magnetic field and temperature. It can be seen that a paramagnetic phase appears in the region where the temperature is sufficiently high. It can be seen that a ferromagnetic phase appears in the region where the temperature is low and the external magnetic field is large. On the other hand, the simulation revealed for the first time that the skyrmion phase appears in the region where the temperature is low and the external magnetic field is moderate. This has not yet been confirmed experimentally, but it is the first reported example of a two-dimensional material. It was found that the skyrmion phase appears in both single-layer and stacked structures. The right figure shows a snapshot of the spin structure at a certain moment obtained by the Monte Carlo simulation. As a result of the simulation, the skyrmion radius discovered this time is 2 nm in diameter, which is the world's smallest diameter compared to skyrmions discovered in the past. Furthermore, it was shown that the clockwise/counterclockwise rotation of the skyrmion can be changed by changing the transition metal, which indicates the possibility of controlling the way the skyrmion vortexes are wound by the gate electric field. In this way, it was found that Quloud-Mag is also effective in searching for new magnetic materials. The simulation results obtained were summarized and reported in a paper (H. Tran and Y. Matsushita, Scripta Materialia 239, 115799(2024).).
